Modern analytics packages allow users to identify and investigate a variety of data types through visual interfaces ranging from dashboards to interactive graphics. Some tools also provide predictive analytics, looking at past events and forecasting future trends. Image courtesy of Seeq.

Latest News
March 1, 2018
The prize? Unprecedented visibility into the production processes, equipment performance and support services at the heart of the industrial sector. The means? Mountains of data from shop floor control and sensing systems. The missing ingredient? Analytics to convert raw plant floor data into insights that will support business and operational decision-making.
To be clear, the problem isn’t that the analytics are unavailable. It’s more complicated than that. For one, many manufacturers simply are not cultivating an analytics capability. A 2016 Forrester Consulting study found that only 33% of the companies collecting data actually leverage this resource to glean actionable insight. The other problem is that finding the right tools to create the analytics your company needs isn’t easy.
Shifting Priorities, Expanding Resources
Until recently, analytics has played a limited role in the industrial sector, focusing largely on condition monitoring. But the emergence of the industrial internet of things (IIoT) and a growing appreciation of the impact of big data in this arena have sparked a revitalization of industrial analytics.
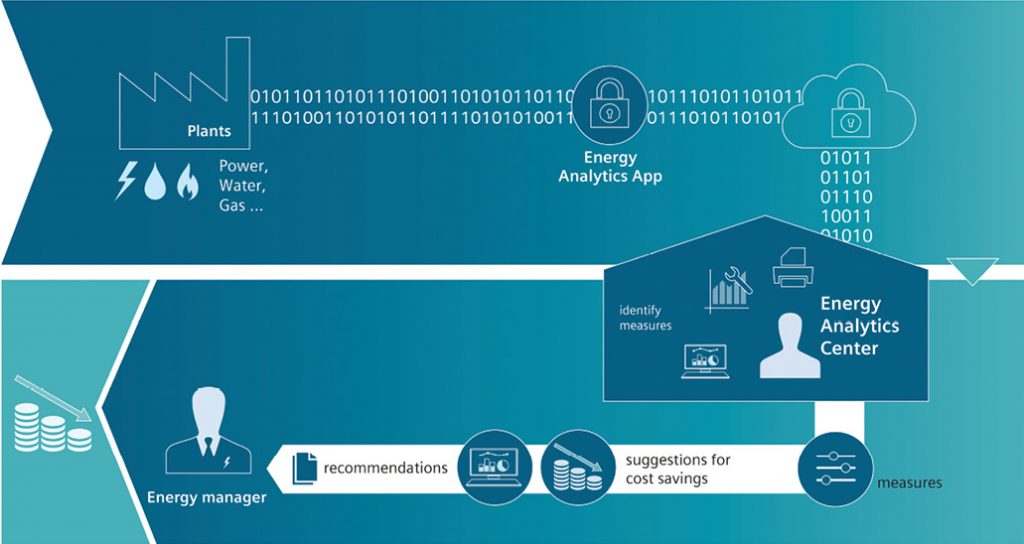 Analytics tailored for the IIoT hold the key to unprecedented visibility into industrial operations, promising greater efficiency in areas ranging from manufacturing processes and energy consumption to oil and gas well performance. Image courtesy of Siemens.
Businesses have begun to realize that their internal data often provides incomplete answers to key questions confronting them. They have found that they do better by combining internal data sets with those from external sources (for example, another plant). To address this issue, IIoT analytics development platforms and applications increasingly offer technologies like advanced programming interfaces to facilitate the integration of different types of input.
The falling costs of sensors, connectivity and cloud computing have made it much more feasible for automation engineers to capture and move data from physical assets on the plant floor to backend analytics. This has made deployment of analytics less daunting, and it has enabled a wider cross-section of companies to take advantage of IIoT data.
A more recent development has attracted great attention. Machine learning has begun to enter the mainstream, with engineers using it in a growing number of applications and industries. In the industrial sector, machine learning promises to enable factory managers to glean more insight from their data. Adopting the technology, however, isn’t without its challenges. Implementing the technology often requires the expertise of data scientists. Unfortunately, there is a shortage in this area, and the data scientists who are available are expensive. In response to this hurdle, some vendors offer tools that aim to make machine learning more accessible, sweeping aside obstacles that have delayed adoption.
Although these developments have accelerated the spread of industrial analytics, some key hurdles remain. Aside from gaining broader acceptance, the most pressing issue centers on storing and processing data. Organizations that rely on database technologies built on Hadoop often experience difficulty with IIoT use cases. Data from sensors and machines typically take the form of time-series data, which can come in high volumes.
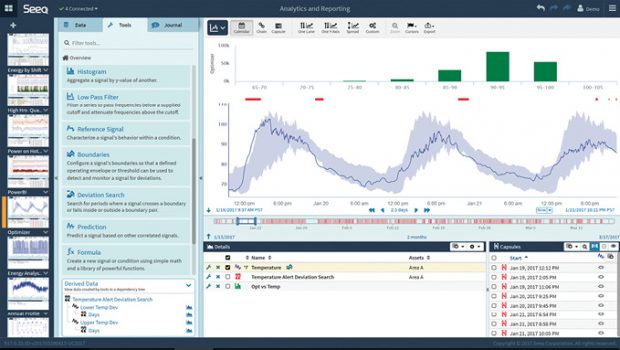 Modern analytics packages allow users to identify and investigate a variety of data types through visual interfaces ranging from dashboards to interactive graphics. Some tools also provide predictive analytics, looking at past events and forecasting future trends. Image courtesy of Seeq.
Unfortunately, systems based on Hadoop tend to be slow at feeding data into the analytic process. In the industrial arena, this becomes problematic if the analyses must be performed in real time. On the flip side, in-memory databases support fast processing, but they often fall short with large-volume data flows. The bottom line is that plant managers and automation engineers have limited technology options in this area.
Edge vs. Cloud-based Analytics
The next hurdle is deciding whether to use an edge- or cloud-based system. Industrial environments encompass a broad spectrum of applications. Some require edge analytics, others, cloud-based systems. Although the number of variables that must be considered before deciding on the type of system to deploy is enough to give anyone pause, engineers and plant managers do have rules of thumb that help their development and implementation efforts.
These guidelines, linked to operational constraints, are listed as follows.
- Scale. Derived information, not raw data, and how it can be acted upon determine the type of analytics required for the application. For example, if the goal is to maximize machine uptime at one plant, then local, or edge, analytics are sufficient. If the scale of the application involves machine uptime across multiple sites—requiring comparisons of the various factories—then analytics should be performed in a higher tier in the system architecture, possibly in the cloud.
- Storage volume. All data must be stored, at least temporarily, and the capacity required depends on the application. As a rule of thumb, more data storage is available in the cloud at a lower cost than on the edge.
- Velocity. High-frequency data, such as vibration or acoustics data, often increase the speed required for data processing. Also, transient event data must include accurate time recording to determine order of occurrence, causality and root cause. With low-latency requirements like these, analytics using high-velocity data should be performed on the edge.
- Response time. Applications that require deterministic analysis, processing and response demand local analytics.
- Timing. IIoT systems typically must correlate data from multiple sensors and process control states, including the timing at which the data is generated. Processing the data in upper tiers of the architecture—without any edge analysis—can overload the system and create bottlenecks. Applying analytics at the edge streamlines timing correlation.
Getting Started
Once you have decided whether an edge- or cloud-based system best suits your application you can begin work on the rest of the system. To obtain the full value of IIoT data, analytics must combine a variety of internal and external data sources. “Real-world decision-making is almost never made based on a single source or type of data,” says Jeff Erhardt, vice president of intelligent systems for GE Digital. “To augment and automate this process with analytics, the systems need to contemplate those diverse sources of data upon which real decisions are made.”
The diversity of the sources covers the full spectrum, including sensors, documents, the web and conventional databases. This variety, however, is compounded by the assortment of the data types that they provide. This data is structured and unstructured, and it comes in formats ranging from data streams and cloud data to NoSQL databases and sensor data. Additionally, the data often has missing values and contains inaccuracies and inconsistencies.
“Within industrial environments, data generation has always been in silos,” says Jagannath Rao, head of the data-driven services unit at Siemens. “Production data, maintenance data, supply chain data and ERP-related data have all been managed by different operations in these environments. In addition, knowledge resides in these data sources both as structured and unstructured data—such as manuals, emails, notes, pictures and videos. To apply analytics and find meaningful and important outcomes, we want to be using all these data sources, correlating various data points to make step changes in productivity, reliability and cost reductions.”
But the data variety that enables IIoT analytics to create such value for industrial organizations comes at a price. You simply cannot apply algorithms to raw data and expect them to provide insights. Before a software algorithm can begin to look for answers, you have to verify the data’s relevance, clean the data, fill in missing values, format and convert the data into a unified form that the algorithm can understand and finally consolidate the data.
Therein lies the rub. This preparation process often takes 60% to 80% of the whole analytical pipeline. Developers of analytics platforms try to provide the means to automate as many steps in the process as possible. But the sheer volume of the data and the extent of its diversity almost guarantee that you will have to spend time on this process before you can begin to apply flashy technology like artificial intelligence.
“Algorithms help, but they are only part of the solution,” says Michael Risse, vice president of emerging markets for Seeq. “The rest relates to the data. If you don’t solve for the realities of working with data—connecting, cleansing, organizing etc.—the algorithms can’t help you.”
Putting Data in Context
Preparing raw data for analysis is just the first step in the process before analytics can be brought to bear to deliver optimum value. After the data is cleaned, consolidated and formatted, it has to be set within its operational context so that engineers and plant managers can gain a clear understanding of risks, options and ramifications.
The analytics software creates context by feeding the processed data through an artificial intelligence pipeline, using machine-learning tools to associate data from the various data streams to create a holistic view of plant operations. Using this structure, analytics models the production processes, operational relationships and interactions. This machine learning-driven contextualization builds a rich repository of events by surfacing like events across a broad spectrum of time, encompassing the full array of plant assets.
The strength of this process comes from the broad array of data types and data sources, such as from DCS (distributed control system), SCADA (supervisory control and data acquisition) and HMI (human machine interface) systems, as well as plant historians and asset management and pricing systems. And this requires a special set of tools. “Running supervised learning on large datasets, of disparate and diverse data types, needs analytical tools tailored for the application,” says Rao. “This is where advanced analytical tools from the machine learning world become an important aspect of IIoT platforms.
Different Analytics, Different Insights
After you have completed the data preparation and contextualization, you are ready to extract insights. Analytics generally fall into three major categories: descriptive, predictive and prescriptive. Each has a different focus, applies different tools and offers different insight. No one type of analytic is better than another, and there is no one-size-fits-all strategy. In fact, these three types of analytics are interrelated and complement one another.
One way of looking at analytics is to view them as a continuum, with each type of analytic serving as a piece of the puzzle. “The time sequence is history, present and predictive,” says Risse. “Figure out what happened, what mattered and why. Then be able to monitor for that scenario, and then extend to predicting outcomes. It’s all one thought—but don’t skip or underestimate the historian analytics. Build a model and backcast it to check for accuracy. Then tune and improve and tweak.”
Perhaps the simplest form of analytics is descriptive analytics. Here, you are analyzing historical data to understand trends and evaluate metrics over time. This form of analysis summarizes raw data and presents it in a form that is interpretable by users, represented either in tabular or graphical form. This technique requires little to no coding, and there are many tools that can handle this analysis, such as QlikView, Tableau and Google Analytics.
Once the analysis process has been completed, it’s up to the user to draw insights. Descriptive analytics are useful to show things like average dollars spent per unit, year-over-year changes in expenditures and total stock in inventory.
The next type of analysis is predictive analytics, which goes a step beyond descriptive analytics by predicting future trends. It accomplishes this by identifying expected behaviors or outcomes, based on predictive modeling using statistical and machine learning techniques. This form of analytics takes the data that an organization has and fills in the missing elements with best guesses. It combines historical data found in MES (manufacturing execution system), ERP (enterprise resource planning) and other plant systems to identify patterns in the data, applying statistical models and algorithms to capture relationships among various data sets.
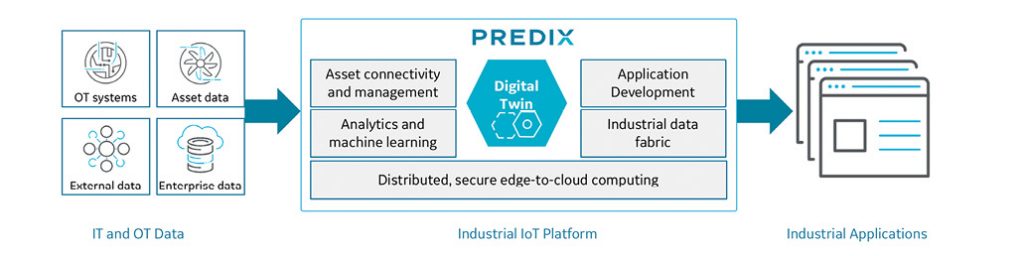 Some providers offer horizontal analytics platforms in which they provide generic analytics development tools and access to a broad collection of building blocks that bring specific vertical or domain analytics to the table. The idea is that the generic tools enable developers to build sophisticated analytics apps, and if a specific building block is needed, it can easily be integrated into the application. Image courtesy of GE Digital.
It’s important to remember that predictive analytics is based on probabilities; the actionable insights it provides take the form of estimates about the likelihood of a future outcome. In the end, they are forecasts and likely will not be 100% accurate. In addition to forecasting future trends, this form of analytics can also predict values of missing fields in a data set and probable impact of data changes on future trends.
A relatively new field in data science, prescriptive analytics takes industrial analysis one step beyond predictive analytics. This form of analytics tries to find the optimal solution by determining what is likely to happen, based on empirical models, first principles and predictive analytics. This approach offers viable solutions to a problem and sketches their impact on future trends.
Prescriptive analytics is still evolving, and the range of use cases to which it can be applied has yet to be defined. But one example of an industrial application would be on-demand production from a geometric assembly model to find the optimal set of manufacturing processes. These results can then be applied automatically to machines and systems, streamlining the production process.
Analytics Options
Recently, the market has enjoyed an infusion of IIoT analytics development packages, some in the form of platforms, others billed as applications. Startups account for some of these, whereas industry giants like Siemens and GE have moved into this area as a natural progression of their portfolio. The variety of options may be enough to spur reticent companies into developing an analytics capability. But this option-rich environment isn’t without challenges. Choosing the right toolset isn’t easy, but a look at the various design philosophies may help.
Many of the startups offer specialized toolsets, leveraging domain expertise. Here, companies like Ambyint target the issues facing specific verticals. In this case, it’s the oil and gas industry, with the focus on optimizing performance.
Other startups specialize in certain aspects of the analytics pipeline. For example, Seeq emphasizes its simplification of data aggregation, cleansing, visualization, search and modeling processes.
Established industry vendors take a more horizontal approach. They offer platforms that provide basic tools and access to a broad collection of building blocks that bring vertical- or domain-specific analytics to the table.
“Manufacturers implementing IIoT should look for platforms that incorporate generic analytics development tools,” says Rao. “These analytics tools have to provide the basis for developing more dedicated apps on the platform. I would classify such tools as machine learning APIs or visual analytics tools. The idea is that these generic analytics tools provided on the platform can enable engineers and developers to build sophisticated analytics apps, and if a specific, not-so-generic building block is needed, it can [be] integrated into the application instead.”
Keep in mind that IIoT analytics are a work in progress, so their final form has yet to be defined. “One thing that’s unclear to me is either the horizontal platforms will begin to develop vertical-centric suites or apps on top of themselves, or they will partner with companies doing that,” says Ryan Smith, vice president of engineering at Sight Machine. “I think it’s too early to tell.”
More Info
Subscribe to our FREE magazine, FREE email newsletters or both!
Latest News